Human expectations occur in a ratio that approaches Phi.


Phi and Fibonacci numbers are used to predict stocks

Markets may be as geometrically perfect as a spider’s web
Ermanometry Research shows the markets to be perfectly patterned, explaining that humans, being part of nature, create perfect geometric relationships in their behaviors, not unlike a spider spinning a geometrically perfect web with no conscious awareness of its amazing feat. Ermanometry applies the logarithmic spirals found in sea shells with dynamic ratios in 3D to relate one market move to others.
Phi, or Golden Ratio, patterns often define the timing of highs and lows and price resistance points
The golden ratio, or phi, appears frequently enough in the timing of highs and lows and price resistance points that adding this tool to technical analysis of the markets may help to identify fibonacci retracements, the key turning points in price movements. The photos below illustrate how the Golden Mean Gauge and Phi-based analysis software (PhiMatrix) can be used to identify these turns in the market. The middle arm of the gauge keeps the phi point of the outer arms as the gauge is opened and closed. The lines of the phi-based software are all in phi relationship to one another. The ratios of Fibonacci numbers, commonly used in technical market analysis, converge on phi as explained on the Fibonacci Series page. Click on each photo to enlarge.
 | 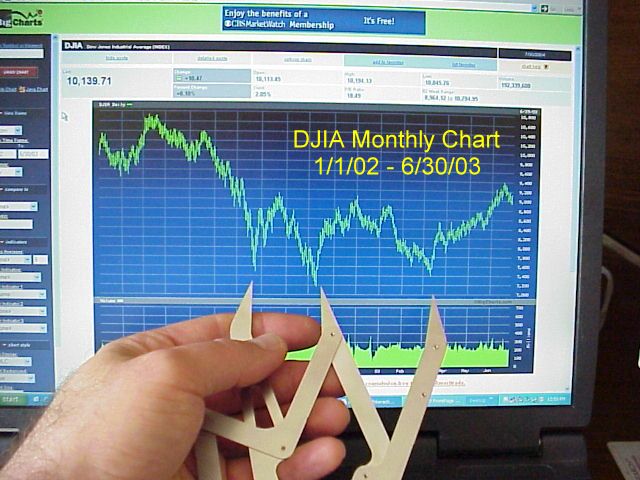 |
| DJIA Daily Chart from 1/2004 through 11/04 using PhiMatrix software | DJIA Monthly Chart from 1/2000 through 6/2003 using a Golden Mean Gauge |
Phi and Fibonacci numbers define the price movements of stocks in Elliott Wave Theory

Fibonacci numbers were used by W.D Gann and R.N. Elliott, pioneers in technical analysis of the stock market. In Elliott Wave Theory, all major market moves are described by a five-wave series, adding to the potential to identify the turns described above. The classic Elliott Waveseries consists of an initial wave up, a second wave down (often retracing 61.8% of the initial move up), then the third wave (usually the largest) up again, then another retracement, and finally the fifth wave, which would exhaust the movement. In addition, each of the major waves (1, 3, and 5) could themselves be separated into subwaves, and so on, and exhibit other Fibonacci relationships.A sample stock price wave analysis could look something like this:

![]()

Major, minor and sub waves are shown in red, yellow and green, and the total number of increases and decreases (2, 5 or 8) is a Fibonacci number. Note too that the predicted end result is based in the Fibonacci series as well as the end price is 61.8% of the high and 0.618 is equal to 1/Φ and 0.382 is 1/Φ2.
For additional information on Elliott Wave Theory, its application and related concepts, please consult the resources below.
Free E-book


Books

Beautiful Pictures – A gallery of simple, clear graphs that show how Elliott waves are in Fibonacci proportion to each other in time and price back to 1932. Click HERE to order.

Elliott Wave Principle – Described as the “the definitive textbook on the Wave Principle,” this classic is the most useful and comprehensive guide to understanding and applying the Elliott Wave Principle. Click HERE to order.

Socionomics: The Science of History and Social Prediction – Illustrates the historical correlation between patterned shifts in social mood and their most sensitive register, the stock market. It also includes essays, based on over 20 years of research, that correlates social mood trends to music, sports, corporate culture, peace, war and macroeconomic trends. Click HERE to order.

How to Forecast Gold & Silver Using the Wave Principle – Robert Prechter’s work in publishing specific gold and silver forecasts for 22 years during one of the metals’ most historically baffling periods and his correct calling of nearly every major turn and trend during that time. The years in question ran from 1979-2001, a period book-ended by gold’s $850 all-time high in 1980, and its low near $250 in 2001. “How to Forecast Gold and Silver” will shows what matters and what doesn’t when you want to invest in precious metals, looking in one place to predict where precious metals would go: to those markets themselves, and how to do it right.
Other books click HERE.


Tutorials / extracts