
In 2021, Bert de Groot, Professor of Governance and Strategic Investment Policy at Erasmus School of Economics, published a paper in “Technological Forecasting and Social Change” titled “Disentangling the enigma of multi-structured economic cycles – A new appearance of the golden ratio.”
In his paper, De Groot examines the economic cycles of GDP growth in over two dozen countries. He found that their durations are grounded in golden ratio relationships. De Groot took an empirical approach to chart a pattern in the lengths of sub-cycles in GDP growth. Understanding the interrelationships between the length of economic sub-cycles then allows their cycles and their fluctuations to be detected more easily. With this information, the resulting signals of future changes in cyclical behavior can provide additional analytic tools to combat economic and societal distress.

Macro to micro economic Golden Ratio and Fibonacci patterns
To some degree, the appearance of the golden ratio in economic cycles should not be a surprise. The appearance of the golden ratio in the timing and price trends of financial markets has been studied and applied by investors for decades in the stock markets, commodities markets, Forex and elsewhere. Their application to the far more complex multi-structured cycles of entire economic cycles though has been much more challenging. Researchers have been seeking to understand these cycles for over one hundred years, so this is where De Groot’s work brings new insights and value.
Method of Analysis
To take on this task, De Groot used time series data of GDP growth for Europe and 25 OECD countries. De Groot relied primarily on Fourier analysis to detect the cycles. With this approach, a series of observations of a variable over a given period of time can be decomposed into cosine waves. When the data showed irregular trends though, this approach can become unusable. To overcome this, De Groot used a Generalized Autoregressive Conditional Heteroskedasticity (GARCH) model. This makes the data less irregular while still preserving the cyclic behavior of the original data. After performing these two tests, De Groot used an algorithm to determine which cycles were prominent. He then lastly estimated a trend-cycle that described the amplitudes and phases of the economic cycles.
Results of Study
The models confirm that the cycles he found strongly correlate with the time series data. Almost all the estimates were statistically significant at a level of 5%. The detected cycles from the sample can describe swings in GDP growth rates of up to 5 percentage points. The models can thus be useful to predict future turning points of an economy as well. This is done by letting the model forecast a part of the data that is left out of the sample, but that is readily available. It is then possible to assess whether the model actually forecasts what happens.
His results indicate two to five cycles are present that in each economy. Cycles with a length of 5–6 years and 9–10 years appear most frequently. De Groot’s paper reveals that “A meta-analysis on the detected cycle lengths reveals that the ratio between the lengths of the shorter to the longer cycles in consecutive cycles often closely matches the golden ratio.” Interestingly, this finding opposes several existing theories about multi-cycle structures, which imply that the lengths of shorter cycles should be integer fractions of the lengths of longer cycles. De Groot’s paper thus provides a new direction for theory development regarding economic cycles and dynamic stability.
GDP Cycle connection to the Golden Ratio
While supported by complex mathematical analysis and statistical correlation analysis, the underlying data and concept can be easily understood. In his paper, De Groot identifies the length of two consecutive economic cycles for over two dozen countries:

De Groot then performs a harmonic regression and other processes and develops a table with the ratios between the lengths of the consecutive cycles:

The average of all the ratios in the above table is 0.619. A probability value for the test of the results against the golden ratio at 0.618 is calculated to be 0.94, which means that the hypothesis cannot be rejected statistically.
De Groot’s full paper can be found here:
https://www.sciencedirect.com/science/article/pii/S0040162521002250
Broader implications of de Groot’s research
With de Groot’s research, we now have further evidence that markets often move in patterns related to the golden ratio. Technical traders have been applying the golden ratio and the related Fibonacci sequence for decades to improve success rates in trading of stocks, commodities, currencies, and indices. De Groot’s work corroborates, with the tools and rigor of academic research, that these same trends can be found on a global macro level in the Gross Domestic Product measures for economic cycles of entire countries, and for the world at large. Given that the economic cycles of countries are certainly related to the activities of the financial markets within them, this correlation should not be a surprise. It’s fascinating though to see his research corroborate the appearance of the golden ratio in such a broader yet application.
Golden Ratios in the timing movements of stock markets
Technical analysts often use patterns based on the golden ratio and Fibonacci sequence to identify price and timing movements in individual stocks and in market indices. The patterns can be shown to occur with relative frequency when looking historically. The challenge is knowing which pattern will appear in future movements. Technical analysts thus use these Golden Ratio and Fibonacci patterns as just one of a number of analytic tools to improve their overall success rates in trades. Market analyst Bill Erman likened it to going down an interstate highway. The analytics can give you an idea of when the next interchange is likely to come up, but you need other information to know whether to go north or south.
Here is an example of golden ratio patterns appearing in the timing movements of highs and lows in the Dow Jones Industrial Average (DJIA):

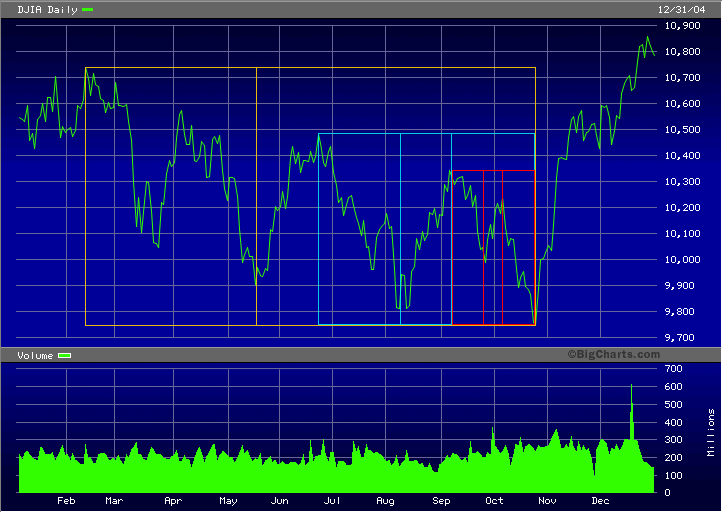
Just as De Groot’s work reveals GDP economic cycles over extended periods of years with durations in golden ratio proportion, the above chart shows multiple cycles with a single year. In this year, the DJAI hit a major low in May between February and October (gold grid), another low in September between June and November (aqua grid) and yet a third in September between September and November (red grid).
Golden Ratios in the price movements of stock markets
The grid below shows the DJIA for the same period, and reveals that the price movements also followed golden ratio patterns. The interim highs and lows are in golden ratio proportions from the market high in February to the market low in October. The price points that define the high and lows are referred to as resistance or inflection points.

PhiMatrix Golden Ratio Design Analysis software was used to create the golden ratio grids in the above charts, and is considered an essential tool by some technical traders and teachers of market trading.
For additional information on how the Golden Ratio and Fibonacci sequence are related to the price and timing movements of markets see these pages:
Stock Market Analysis, Phi and the Fibonacci Sequence