Kalana Dido of France made a very insightful discovery in May 2021 that unites the visual spectrum of light, the proportions of the human body, the chakras (i.e, the centers of spiritual energy in the human body in Hindu tradition) and the Golden Ratio. This integrates four separate concepts, making it one of the more fascinating discoveries of Golden Ratio appearances I’ve seen in recent years. Let’s explore each topic and then see how they then relate.
The Visual Spectrum of Light
Most people know the familiar colors of the rainbow and the visual spectrum of light as red, orange, yellow, green, blue, indigo and violet. This is often referred to by the acronym “ROYGBIV”:
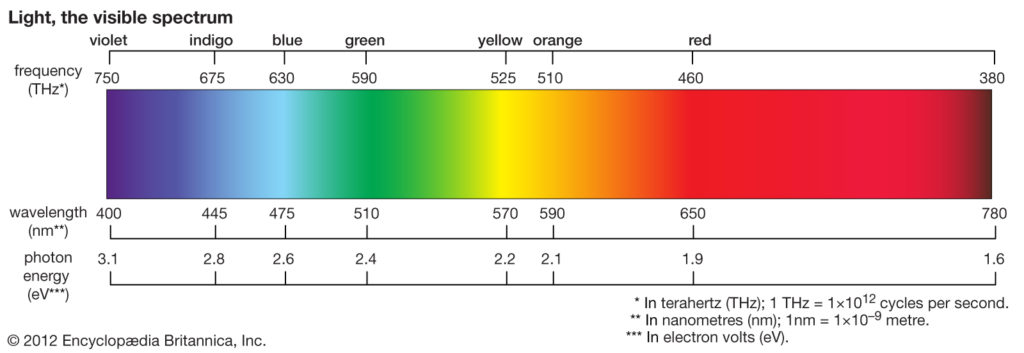
Have you ever noticed though that the individual ROYGBIV colors we readily distinguish are not evenly dispersed across the spectrum? Some colors are tightly grouped within a small range of wavelengths and frequencies. Other colors spread across a wider band. Keep that thought.
Chakras and the Human Body
The concept of Chakras originated in the early traditions of Buddhism and Hinduism. The Sanskrit word “chakra” means “disk” or “wheel,” and refers to energy centers of the body, each corresponding to specific nerve centers and major organs. Early Sanskrit texts refer to them in meditative visualizations and also as physical entities within the body. In Hindu thought, there are seven primary chakras. These run from the base of the spine to the crown of the head. They are are often depicted in an image like the one below:
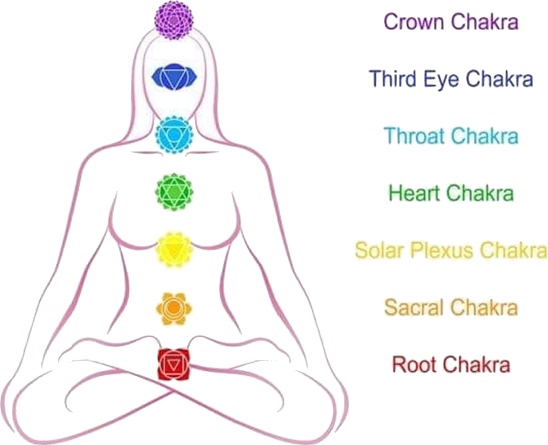
Note that the seven colors associated with the seven chakras correspond directly to the seven ROYGBIV colors of the rainbow and visible spectrum. The chakras appear evenly spaced on this diagram, but their actual positions on the human body vary in spacing. Keep that thought too.
The Golden Ratio Connection to Light, the Body and the Chakras
The amazing connection in these concepts came to Kalana Dido when he began to “connect the dots” in the pattern of spacing that was common to both the visible spectrum and the chakras of the human body.
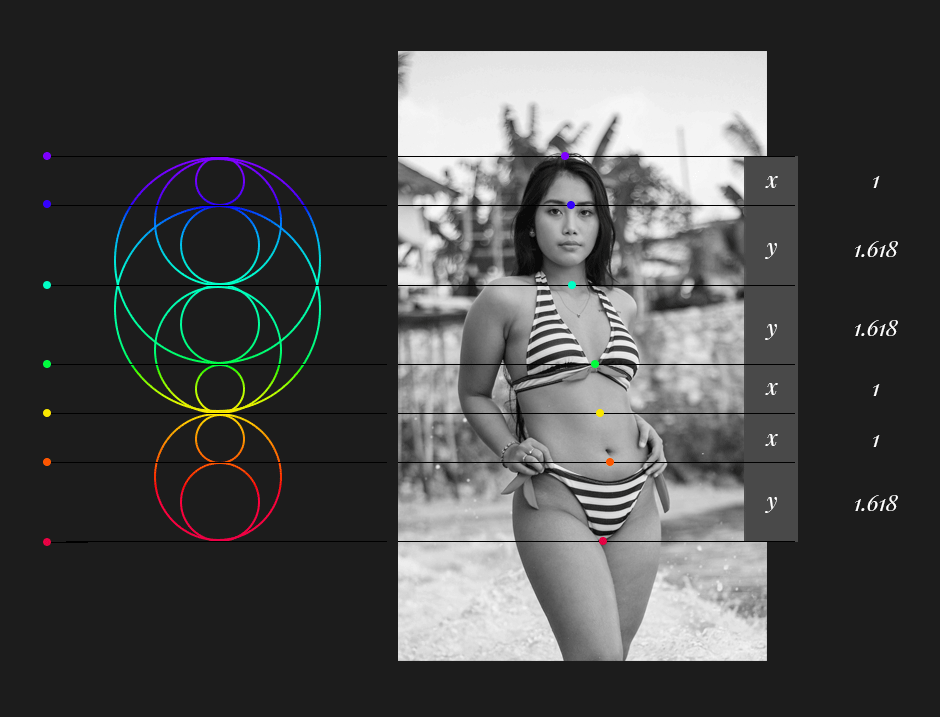
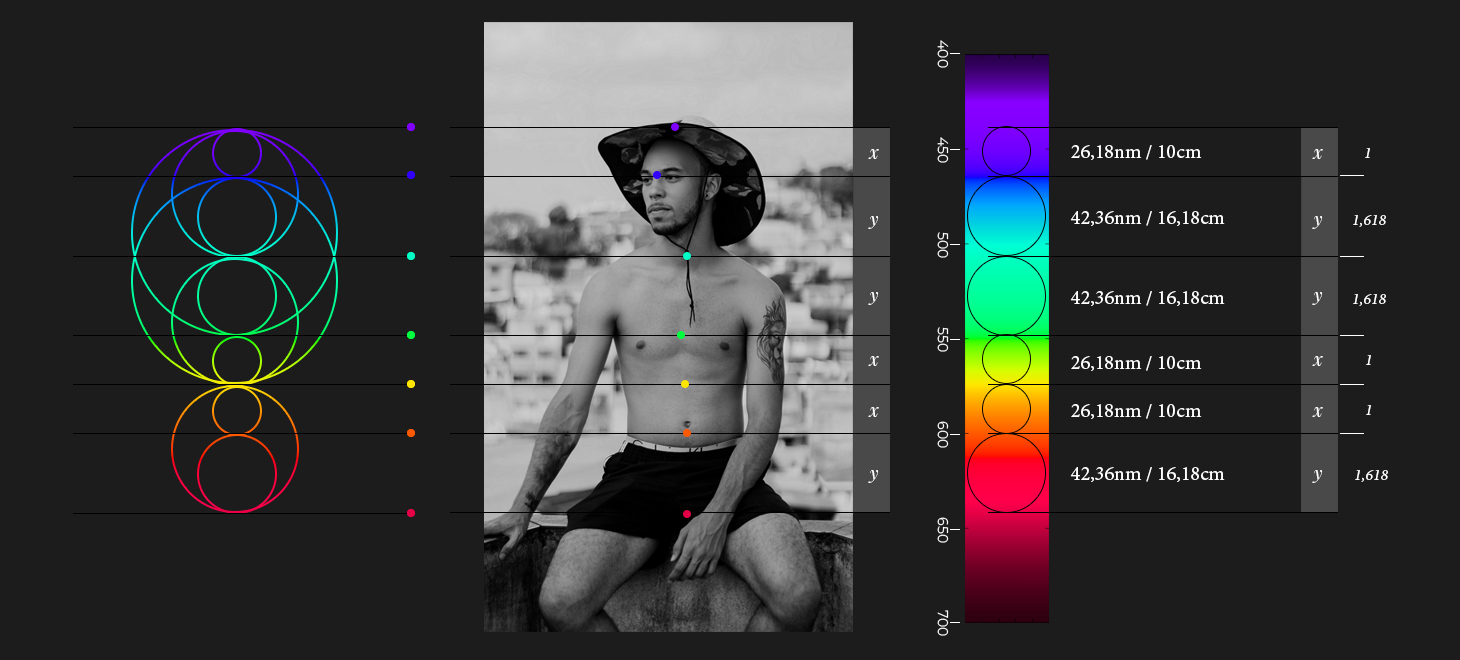
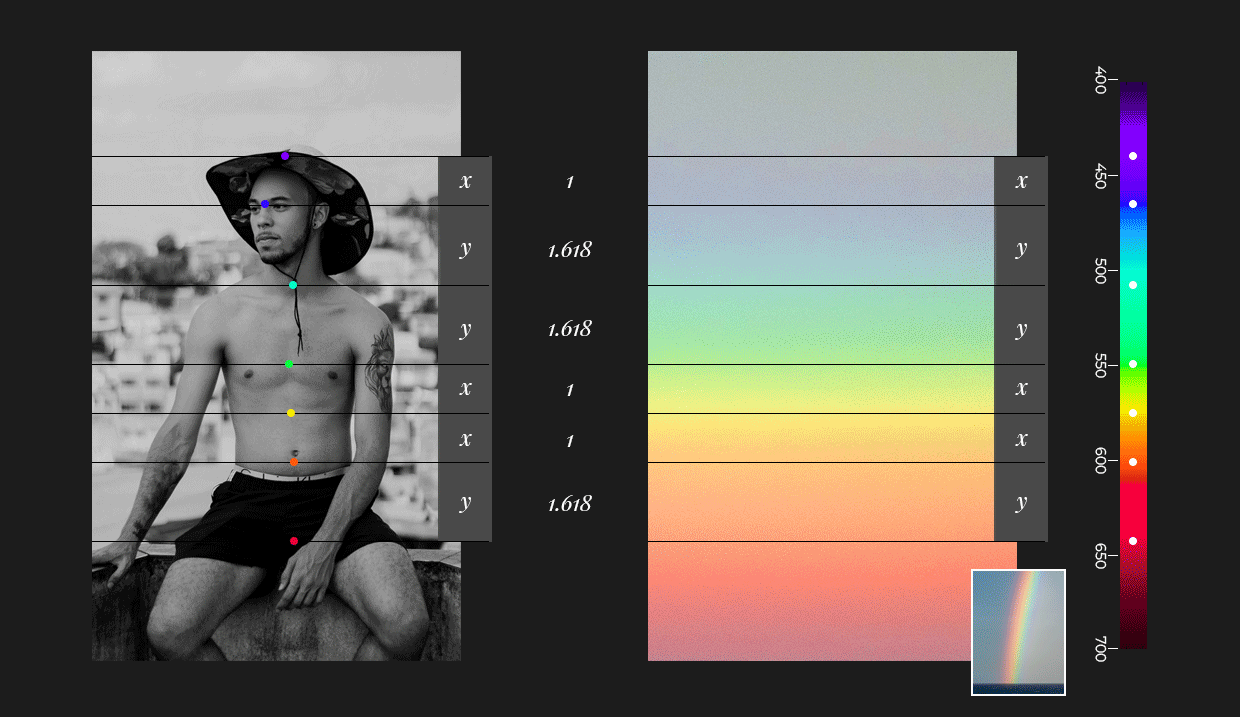
The visible spectrum extends from the lower red frequencies of about 380 to 450 nanometers to the higher ultra-violet frequencies of about 625-700 nanometers. Kalana searched for a pattern to explain the uneven spacing in the spectrum and actual positions of the chakras on the human body. He noticed that the breaks that best defined the colors fell at alternating gaps of about 26 and 42 nanometers. Curiously, he noted that these numbers, which are double the numbers 13 and 21 of the Fibonacci sequence, have a ratio of about 1.615. This is a variance of only 0.16% from the golden ratio. He revised his model ever so slightly and found that it matched even better using golden ratio proportioned gaps of 26.18 and 42.36 nanometers.
He created this illustration of his concept. Note that the lines between the golden ratio-based circles indicate the primary color breaks, not what is within the circles themselves:
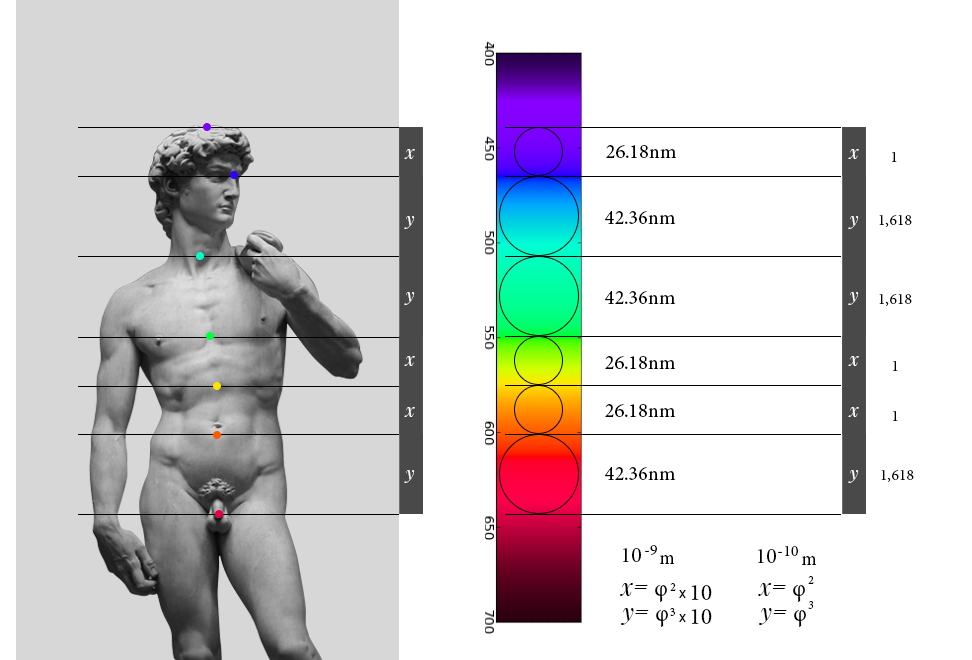
Note how the alternating gaps of the ROYGBIV colors of the spectrum align very closely with the positions of the chakras on the body:
- Red – Root (Muladhara) chakra, at the base of the spine. (Trust, belonging)
- Orange – Sacral(Swadhishthana) chakra, located just below the navel. (Sexuality, creativity)
- Yellow – Solar plexus (Manipura) chakra, located at the solar plexus. (Wisdom, power)
- Green – Heart (Anahata) chakra, located at the heart (Love, healing, relationships)
- Blue – Throat (Vishuddha) chakra, located at the throat (Communication, expression, truth)
- Indigo – Third Eye (Ajna) chakra, located between the eyes (Awareness, intention, purpose)
- Violet – Crown (Sahastrara) chakra, located at the top of the head (Spirituality, connection to the divine)
Note too how the seven ROYGBIV colors of the visible spectrum are spaced according to same alternating gaps of 26.18 and 42.36 nanometers. These numbers have relative ratios of 1 and 1.618. Oddly enough, these numbers also beautifully mirror the square and cube of the golden ratio, 2.618 and 4.236.
It has long been clear that the colors of the spectrum correspond to the colors of the chakras. It’s amazing though to connect the varied spacing gaps of the ROYGBIV colors in the spectrum to the same spacing in the chakras. To find that the spacing is related to the golden ratio is beyond amazing. What led the ancients of Hinduism to pick these particular positions to define the chakras? By contrast, various Buddhist traditions use 4, 5, 7 or 10 chakras. The 5 Buddhist chakras are sequenced from the base of spine to crown with colors of green, yellow, blue, red and white, which do not even correspond to the visible spectrum of light. It begs this question: Did the ancients of Sanskrit and Hindu tradition had a much deeper insight into the nature of energy, light and the human body than Western tradition may give them credit for?
Testing the model for validity and accuracy
I credit Kalana with much ingenuity and insight in finding these fascinating relationships, and thank him for bringing to my attention. I’m always excited to learn about new appearances and applications of the Golden Ratio. I’m also just as passionate about using my auditing background and analytic skills to assure that what is published on GoldenNumber.net is as accurate as possible. Kalana’s model fits the chakra positions on David’s classic male body above. It also fits the visible spectrum illustration quite well, but we put the model to the test.
Analysis of alternative spacings
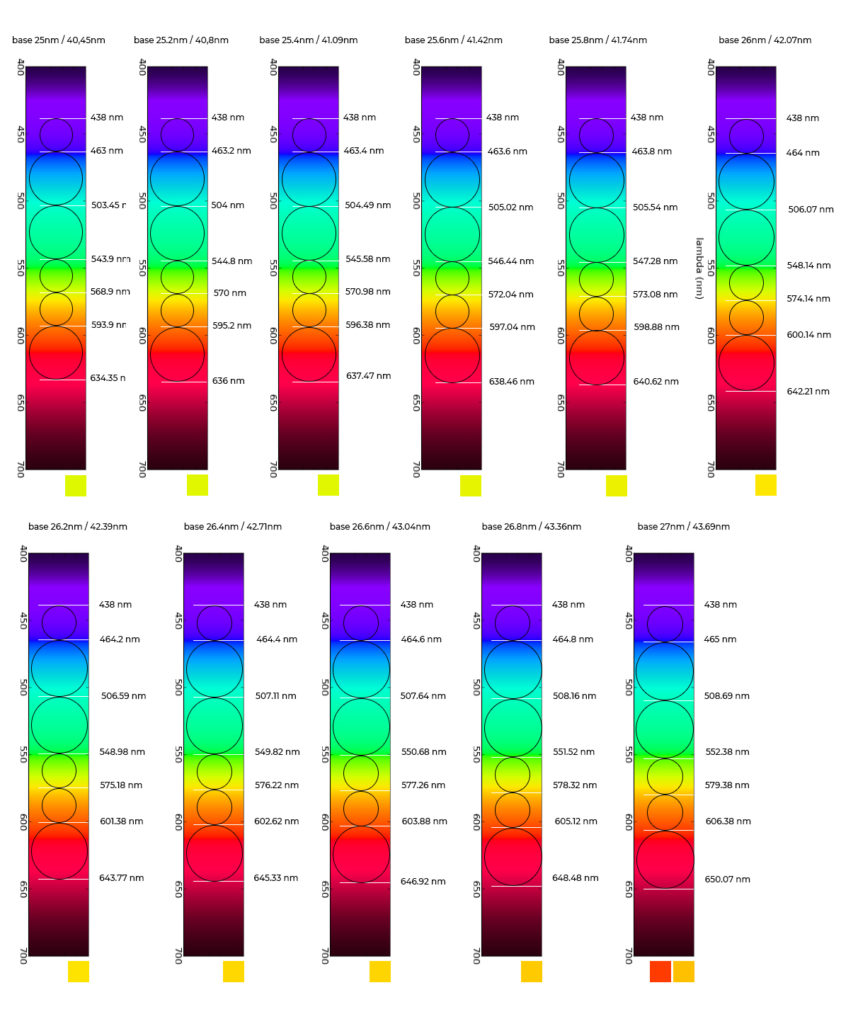
Kalana tested his model with base wavelengths of 432 to 438 nanometers, and spacing gaps ranging from 25 to 27 nanometers. In doing so he found that the optimal spacing gap for alignment to the ROYGBIV colors occurred with a base of 438 nanometers and alternating gaps based on 26.2 and 42.3 nanometers. Below is a sample of his analysis:
Analysis of correlation to stated color wavelengths
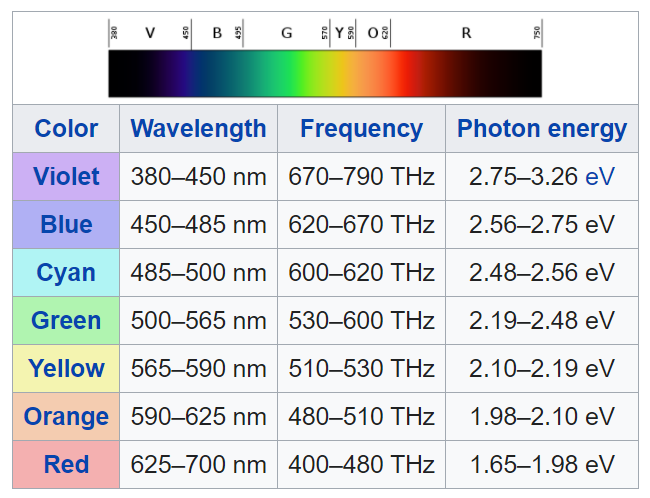
To test the theoretically derived wavelengths from Kalana’s model, I compared the wavelengths for each color in his model to the stated wavelengths for each color of the visible spectrum as listed on Wikipedia:
I then created the graph below to show how the theoretical wavelengths in Kalana’s model compared to the Wikipeida color ranges:
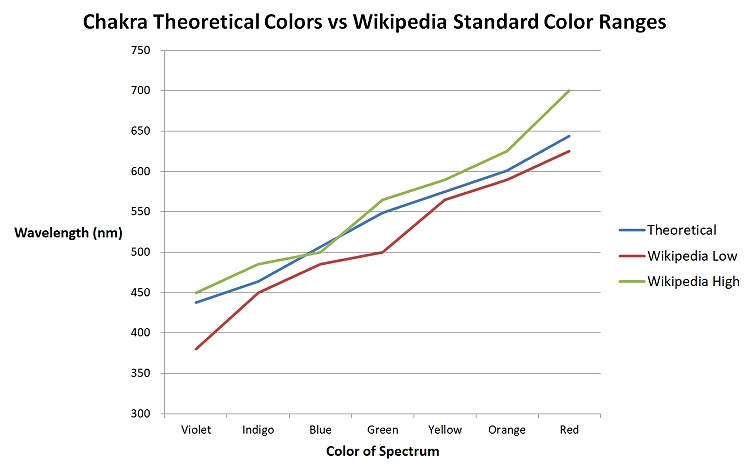
The chart reveals that all of the theoretical wavelengths derived in Kalana’s model (in blue) fall cleanly between the actual low (in red) and high (in green) wavelengths for each respective color, with one exception. His model has blue at 506.54 nanometers while Wikipedia shows the actual color range for this color, which its calls cyan, has a range of 485 to 500 nanometers. This is a slight variation indeed of only 1.3% above the maximum, and is likely not that noticeable to the eye.
Analysis of spectrum images to actual spectral photos
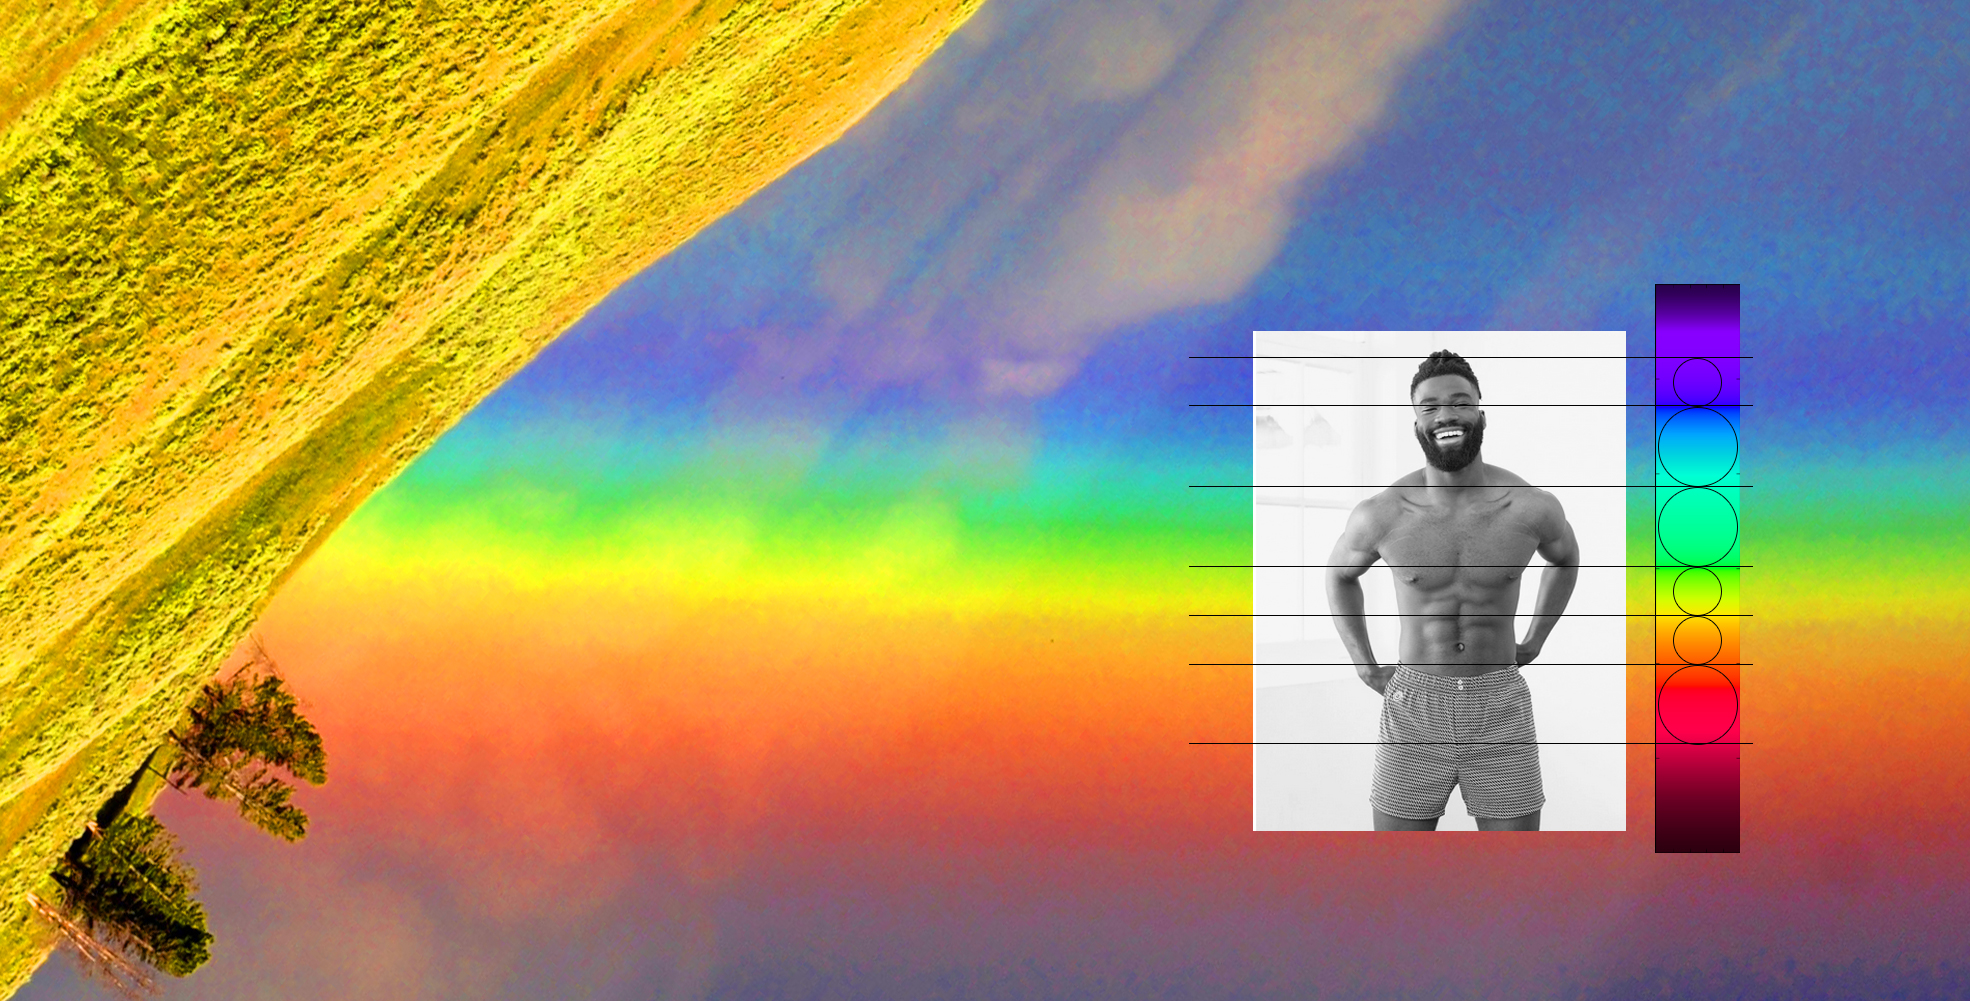
In my analysis of Kalana’s work, it became very clear, and very frustrating, to find that there were many variations in images showing the visible color spectrum. Further research led me to learn that the spectrum of colors generated by RGB color monitors do not correspond exactly to the spectrums of sunlight that appear in nature. RGB monitors create 16,777,216 colors, but this is all based on all the mathematical combinations of 256 variations of red, blue and green. This realization just about led us to abandon the work on this model altogether. I suggested though that we use the nature spectrum of sunlight from rainbows rather than the various RGB renditions and artist renditions of spectrums. Kalana developed a new set of models based on photos of rainbows, and it still corroborated the results.
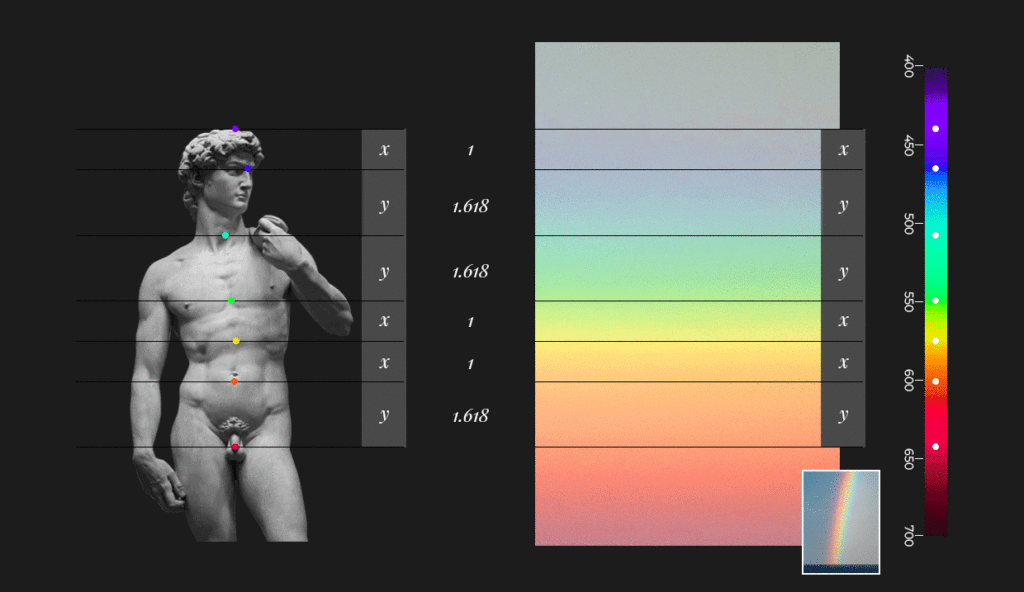
The image below applies Kalana’s model to the statue of David again. It uses three actual photos of rainbows, as shown in the inset at the lower right, as the source for the color spectrum:
Analysis of impact of individual body variations
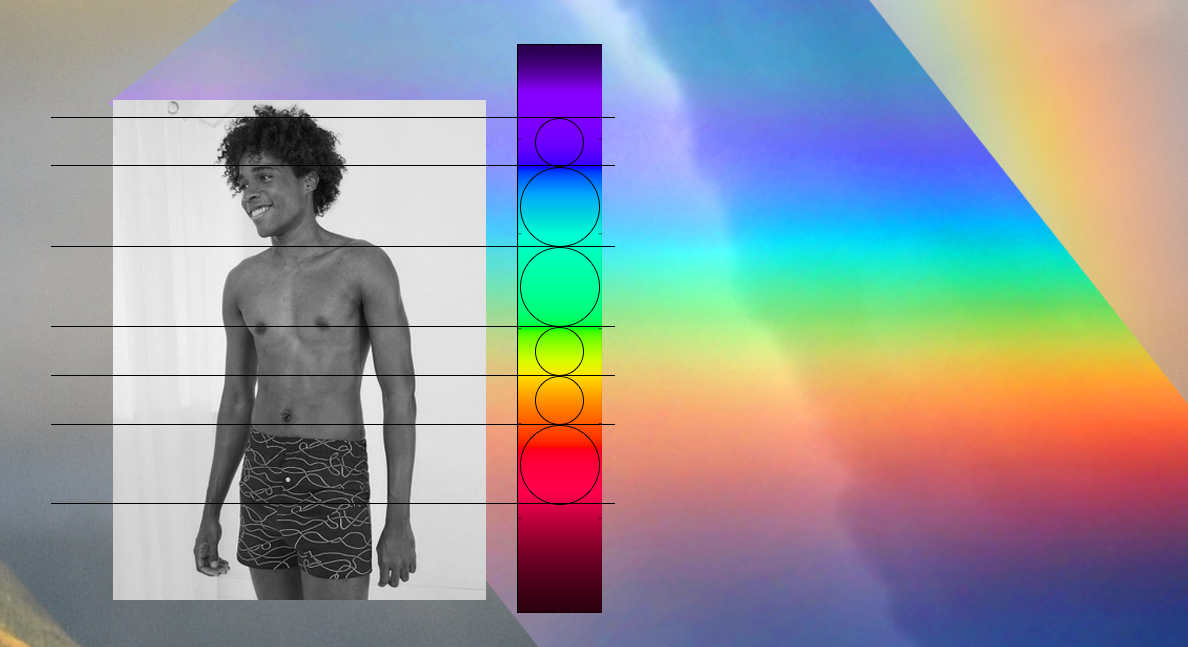
Another potential challenge to the model was that the body proportions of individual people are of course not identical. To put this to the test, Kalana found a set of models from a swim suit site, and created yet another set of images. Despite the small range of individual differences, the results were still consistent and compelling. The images below compare a sample of individual bodies to actual photos of rainbows. Click on any image for the full size version:
Background
As a background to this story, Kalana Dido is interested in colors and their effects on the human body. He wanted to see if there was a correspondence between the visible light spectrum and the chakras. He aligned the chakras and the spectrum by shifting and resizing the images with the ratios in proportion. It was then that he noticed that the symmetries took shape.
He then measured the gaps and noticed that it was very close to the golden ratio. By shifting only 1 or 2 pixels with the chakras aligned to the spectrum, the golden ratio appeared everywhere in only two proportions. At this first stage, he noticed a spacing of 26nm and a second at 42nm, with its ratio of 1.615…, as being very close to the golden ratio of 1.618…
Kalana then wanted to solve the question of the exact value of the base by taking the reference spectrum and calibrating the wavelength of the yellow. He did this by taking 10 bases every 0.2 nm from 25 to 27 nm. After having establishing a corresponding set of yellows, he oriented his work to the 26.2nm base which seemed to best correspond visually to a real yellow. Soon thereafter, he made the connection between 26.2nm and 2.618 (phi squared) and 42.36nm and 4.236 (phi cubed).
Kalana isn’t taking these findings too seriously without additional scientific confirmation. He has a level of certainty though that the chakras are distributed according to a pattern of yxxyyx from base to crown, where y=Φx and Φ represents the golden ratio.
Conclusions
Kalana and I both regard this as a fascinating insight. It allows us to understand the association of several concepts. It appears to be yet another appearance of the golden ratio in nature, with its correlations to the human body, the seven key colors of the visible spectrum of light and the seven chakras of Hindu and Sanskrit traditions. It is not presented as a proven scientific concept or body of scientific evidence.
We hope that this presentation of Kalana’s original research and findings may lead to work by others. Key concepts to take away include:
- The research reveals an apparent alignment of colors and positions in the chakras and the visible spectrum of light based on actual photos of rainbows and corresponding visible spectrum images.
- The research demonstrates apparent golden ratio relationships in that alignment, with a base gap of approximately 26 nanometers, and with 42 nanometers as its golden multiple (26 * 1.618 = 42.07).
- Testing was conducted to find the most accurate value for the gap in the wavelengths by comparison of results in 0.2 nm steps from 25nm to 27nm.
- It was determined that the 26.2nm base gap produces the most consistent results.
- The model then uses Φ²x10nm (2.618 nm) and Φ³ x10 (42.36 nm) as the golden ratio-based theoretical measures of the gaps.
- The model uses a scale of 10-10 meters for x and y, where in the illustrations x = Φ² and y = Φ³.
- A base of 438nm was chosen as the reference point based on best fit. The exact wavelengths of the colors cannot be defined without knowing the base. It could vary from 438nm slightly, but this was not found to impact the results significantly.
- We acknowledge that the connection of the gaps in nanometers of 26.18 and 42.36, and the association of those numbers to the square and cube of the golden ratio of 2.618 and 4.236 is interesting and convenient, but unexpected and not necessary to the model. Nanometers are of course just one unit of measure, and the actual digits would be different if measured in inches or some other unit of measure. France is credited with the invention of the meter, which in 1790 was defined as one ten-millionth of the distance between the North Pole and the Equator through Paris. There is thus no obvious or implied reason for this connection in these mirrored digits other than coincidence … or a grander cosmic plan that is beyond our comprehension.
An invitation to continue the research
We invite anyone to test these results, further refine them and to share any new findings with Kalana and I.
You may also want to try this: In his research, Kalana made two sections of string in golden ratio proportion and used them to measure his own body. He found his own chakras fit the model as well. We’ll just invite you to take your own measurements and share your results in the comments below.

Yeah is right we need to focus on our self leave everything behind we been blind for a long time when you have a balance with your self n soul that’s when the pattern s start to appear ,numbers,you see the same things alot n start to make sense all you got to do believe on your self n be unic not a follower n take your own decisions listen to your heart your mind may trick you ??n well is a long way to go n alot test in life never ends but we have to open our eyes n see the reality fear no evil ?
Hi, I’ve been a Chakra Balancer in the US since 2009. In one of my courses with my teacher, the late Arlyn Kline, she said she had an audio cassette recorded by Dr. Valerie Hunt that had sounds of the seven chakras.
We tried to meditate as she played the cassette and read a document that explained the sounds of each chakra. I’m also a musician and recording engineer, as it turns out. As the first chakra played she read that it was one specific frequency. No, it wasn’t. Nor were any of the other paragraphs correct that she read about the other six.
After class I went to her privately and told her I had a crisis of confidence. She was shocked and asked why. I told her that while the sounds she played may have been of chakras, the info she read was totally wrong. She suggested that I contact Rosalyn Bruyere, who had been Alryn’s teacher and whom had worked with Dr, Hunt.
I knew Rosalyn and did just that. I got back an email that said Dr. Hunt had taken that cassette off the market years ago and it was not to be used,
But that got me thinking. Can the colors of the chakras be converted to frequencies of sound. I looked the frequencies up. About 440 TeraHertz to about 760 TeraHertz. Oh, so the musician in me wakes up and says, “The visible light spectrum is an OCTAVE in TeraHertz. How convenient!”
How do I convert TeraHertz to Hertz? Decimate! Drop the Tera.
Then the realization that 440 Hz is Concert A. So RED is the first chakra. Violet is the seventh chakra.
I first built a First Chakra Soundscape consisting of six octaves of A, I figured that upper and lower harmonics in A would add to the power of a 440 Hz A. What does that sound like?
Here are all seven. https://tyford.bandcamp.com/album/chakra-soundscapes
In addition, after making them I wondered what they would sound like if they were all played at the same time together. That’s the last track, “Bliss.”
These soundscapes are very powerful. I then re-created them so that each chakra soundscape went up in seven steps to the next, I call that CD, “Ascension.” I gave a presentation to the Edgar Cayce Center in NYC some years back. A young woman from the audience came to me later and told me that she had MS, but that experiencing these soundscapes allowed her to feel electricity flowing in her body that the MS had blocked.
I followed up with a client here in Baltimore upon my return. He had life-long MS. After years of numbness from his left hip to left foot, I was able to restore feeling after three Chakra Balancing sessions. while playing the CD. The effect lasted for a year and a half. When it started to fade, one 1hr session opened him back up again,
Thanks for putting your info out there.
Regards,
Ty Ford
I am a musician and sliritual voyageur & have utilized chakra tonings for some years. Each Chakra also has a specific sanskrit bija (seed) mantra associated with it that can be intoned to the associated note. The “literature” associates the root Chakra with the C note and then a major scale up to the B note of the third eye Chakra and then the octave C for the crown. The universe constantly emits a Bb note. I am curious as to what supports using the A 440.
Another interesting consideration is the emergence of thought around the ‘Divine Frequency’ which lowers A 440 htz concert to A 432 htz concert. This divine Frequency can be demonstrated to provide more integrated & symmetric forms when applied using a tonoscope.to view the resulting form. Many quartz crystal bowls in use for Chakra toning are set-up in A 432 htz. My experience is these bowls have strong benefits/effects on the human energy field.
I am curious about the 432 vs 440 htz tunings as well. Sources disagree on whether that is the heart chakra or base chakra note. I’m a yoga therapist and Reiki Master and have been using the chakras as a lens to help my students and clients understand themselves better for several decades, it is fascinating work!
Small additional note:
If we take φ⁴ × 100 as a base, and then apply the deduction using this scheme by subtracting φ³ to define the root chakra, we obtain the following results:
Root chakra: 643.0495 nm, i.e. 280φ + 190
Sacral chakra: 600.6888 nm, i.e. 260φ + 180
Solar plexus: 574.5085 nm, i.e. 250φ + 170
Heart chakra: 548.3281 nm, i.e. 240φ + 160
Throat chakra: 505.9675 nm, i.e. 220φ + 150
Third eye chakra: 463.6068 nm, i.e. 200φ + 140
Crown chakra: 437.4264 nm, i.e. 190φ + 130
I’m not sure whether these values are accurate, but in any case, they are consistent with the initial observations.