
Human expectations occur in a ratio that approaches Phi.
 Changes in stock prices largely reflect human opinions, valuations and expectations. A study by mathematical psychologist Vladimir Lefebvre demonstrated that humans exhibit positive and negative evaluations of the opinions they hold in a ratio that approaches phi, with 61.8% positive and 38.2% negative.
Phi and Fibonacci numbers are used to predict stocks
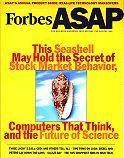 Phi (1.618), the Golden Mean and the numbers of the Fibonacci series (0, 1, 1, 2, 3, 5, 8, …) have been used with great success to analyze and predict stock market moves, known as retracements. Forbes ASAP featured a story on the work of scientist Stephen Wolfram in cellular automata (underlying rules that determine seemingly random phenomenon) stating “This seashell may hold the secret of stock market behavior, computers that think and the future of science.”
Markets may be as geometrically perfect as a spider’s web
Ermanometry Research shows the markets to be perfectly patterned, explaining that humans, being part of nature, create perfect geometric relationships in their behaviors, not unlike a spider spinning a geometrically perfect web with no conscious awareness of its amazing feat. Ermanometry applies the logarithmic spirals found in sea shells with dynamic ratios in 3D to relate one market move to others.
Phi, or Golden Ratio, patterns often define the timing of highs and lows and price resistance points
The golden ratio, or phi, appears frequently enough in the timing of highs and lows and price resistance points that adding this tool to technical analysis of the markets may help to identify fibonacci retracements, the key turning points in price movements. The photos below illustrate how the Golden Mean Gauge and Phi-based analysis software (PhiMatrix) can be used to identify these turns in the market. The middle arm of the gauge keeps the phi point of the outer arms as the gauge is opened and closed. The lines of the phi-based software are all in phi relationship to one another. The ratios of Fibonacci numbers, commonly used in technical market analysis, converge on phi as explained on the Fibonacci Series page. Click on each photo to enlarge.
 | 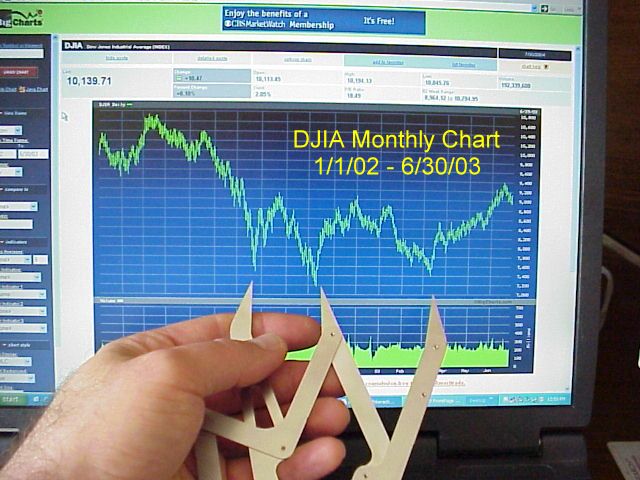 |
| DJIA Daily Chart from 1/2004 through 11/04 using PhiMatrix software | DJIA Monthly Chart from 1/2000 through 6/2003 using a Golden Mean Gauge |
Phi and Fibonacci numbers define the price movements of stocks in Elliott Wave Theory
Fibonacci numbers were used by W.D Gann and R.N. Elliott, pioneers in technical analysis of the stock market. In Elliott Wave Theory, all major market moves are described by a five-wave series, adding to the potential to identify the turns described above. The classic Elliott Waveseries consists of an initial wave up, a second wave down (often retracing 61.8% of the initial move up), then the third wave (usually the largest) up again, then another retracement, and finally the fifth wave, which would exhaust the movement. In addition, each of the major waves (1, 3, and 5) could themselves be separated into subwaves, and so on, and exhibit other Fibonacci relationships.A sample stock price wave analysis could look something like this:
![]()
Major, minor and sub waves are shown in red, yellow and green, and the total number of increases and decreases (2, 5 or 8) is a Fibonacci number. Note too that the predicted end result is based in the Fibonacci series as well as the end price is 61.8% of the high and 0.618 is equal to 1/Φ and 0.382 is 1/Φ2.
For additional information on Elliott Wave Theory, its application and related concepts, please consult the resources below.
Free E-book

Books
Beautiful Pictures – A gallery of simple, clear graphs that show how Elliott waves are in Fibonacci proportion to each other in time and price back to 1932. Click HERE to order.
Elliott Wave Principle – Described as the “the definitive textbook on the Wave Principle,” this classic is the most useful and comprehensive guide to understanding and applying the Elliott Wave Principle. Click HERE to order.
Socionomics: The Science of History and Social Prediction – Illustrates the historical correlation between patterned shifts in social mood and their most sensitive register, the stock market. It also includes essays, based on over 20 years of research, that correlates social mood trends to music, sports, corporate culture, peace, war and macroeconomic trends. Click HERE to order.
How to Forecast Gold & Silver Using the Wave Principle – Robert Prechter’s work in publishing specific gold and silver forecasts for 22 years during one of the metals’ most historically baffling periods and his correct calling of nearly every major turn and trend during that time. The years in question ran from 1979-2001, a period book-ended by gold’s $850 all-time high in 1980, and its low near $250 in 2001. “How to Forecast Gold and Silver” will shows what matters and what doesn’t when you want to invest in precious metals, looking in one place to predict where precious metals would go: to those markets themselves, and how to do it right.
Other books click HERE.

Tutorials / extracts


I work in a telecommunications company and while i was reading this paper http://www.chetansharma.com/mobilecompetition.htm i was surprised to see that between the top three operators in the 40 countries studied over the past decade, in order to achieve an equilibrium point in the mobile market (where prices are competitive and the revenue allows companies to still invest in this market) the average ratio of the market share between the first and second operator and also between the second and third operator is 1.6!!! Coincidence?
Very interesting read, I have recently joined the stock market and look forward to testing this strategy for trading!
Did it work?
based on the golden ratio you will have to wait until 2025 to receive your answer.
I would like more info on how to use the matrix with the markets. Do you just place this grid on top of the market interactive chart? Seems that the matrix can be interpreted to what you want to see. Anyone who can explain how to use would be appreciated.
PhiMatrix is a tool that must be used in conjunction with other techniques and indicators. Carlos Wolf at http://www.fxtectips.com/ recommends PhiMatrix in his Forex training program, so that may be a good source for more detailed information.
Gytana . . .
I’ve found that using Fibonacci Levels in conjunction with other technical analysis (i.e., support and resistance levels, trend lines, price patterns, etc.) works very well. The more confirmation price is expected to hold at a particular level the more trustworthy that level should be.
Good Luck!
Chartsky
Anyone can explain how Gann used Fibonacci ratios in his studies or analysis .
This site has certain ethical considerations concerning disseminating information about PHI and its’ relationship to financial markets, for obvious reasons. It’s probably because of this, that the above information places the majority (>61.8%) of the movements of the market primarily on human behavior, as it mirrors other natural systems. Those who post comments on this site, have none of these ethical considerations. For example, the difference today, is that high speed proximity traders, dark pools, and sovereign wealth funds use complex mathematical algorithms based on PHI to exert a much greater influence on market behavior than humans. Back in the day when investors would own a stock for weeks, months, and years, this may have held true.
The average has changed dramatically, however, to just days, hours, and minutes. The reality of individual stockholders in large numbers determining the movements of the market has changed dramatically, as well. Otherwise, how else could the Shanghai Composite Index, for example, on June 4, 2012, the 23rd Anniversary of the Tiananmen Square Massacre of June 4, 1989, open at 2346.98, and be down at the close, exactly 64.89? The Friday, 3-6-6 S&P generational bottom, hit 666.666…The market reversed on 3-9-6 and has been going up ever since. How much you ask? Five years (1826.18 days) to the day later, 3-7-14, the S&P was at 1884, up 1218 points. Per day, 1218/1826=.666… Now, the funny PHI part, at least one of them, is that 366 days X .18=the 66th day, or March 6, (3-6)! Just recently, on 3-2-15, near the 6th Anniversary, the market closed at
2117.39, or 3.1618 X 666.69 (the 3-6-6 closing value)!
Behavioral Finance is real, but so is PHI. In this context, PHI is the Z-axis, the TIME-axis, the only axis algos care about, no matter what investors are caring about.
Hi Peter Hedding
Very interesting post. I think Gann used alot of these techniques, more than he let on anyway. What do you make of the recent correction? Are you a full time trader?
Cheers
Wes
I taught high school Economics for almost 50 semesters. I still haven’t made up for the money I lost in the summer of ’08. My first day of trading was 2-08-08 and I bought three stocks,; ROCK, ROLL, and TUNE! And I bought a bunch of the VISA IPO and still managed to lose money on the deal! I did it for real, though, rather than through simulations, to be better able to teach my students. They did the simulations! Mainly, though, I’m an Historian, who has been going back over everything I’ve ever learned, but now with The Divine Proportion as my Rosetta Stone. All of the Social Studies, are all about 1:1.618. And none of the other Arts and Sciences, can be fully understood, without The Divine Proportion! Believe me, I tried. As for the current correction, things should come back Oct. through May of 2016. We’re heading into the final year of the Obama presidency, and also the end of 7 fat years. The lean years are due, and don’t forget, the future PHI dates of 1-6-18, 1-16-18, and the midterm elections on 11-6-18, are almost upon us!
omg. This is so true
CNBC and the like, are commemorating the 7th Anniversary of the Generational Bottom of the S&P. Don’t forget however, that it did start going back up on March 9, 09 but that was a Monday. The Crash capitulation came on the previous Friday 3/6/9, which this year was March 4th., where the S&P closed a whisker above/below 2000. Take the very lowest value of this index for the 500 biggest companies in the world seven fat years ago, 666.67, and multiply it by three, and you get 2000. So, anyone with stocks in a portfolio or mutual funds came out well. Those without these assets, not so much.
Fascinating. The connection between Phi and the universe is immense!
wow such amaze
this memes so much to me
I was suppose to write an school essay but somehow ended up in this site which is very positive thing :D.
I have found by using these exact same methods and pythagoran theorem that this is crazy accurate.
I had my initial idea about 9 months ago when I realized that things that happen in nature happen in some kind of cycle. Not knowing any more about math than what people learn in high school,the thing that came to my mind was pi (3.14159265359). Many probably have heard the saying that history repeats itself so I imagined it as an circular loop. I ended up to google the history of recessions. I took a time period between two lowest point in the graph and place it into 2pi*r (r= time period). The result almost always ended up to be the exact year of low point of deep recession or very close. I was so exited that I started to think what if I could for example expand the size of these cycles as the time is moving forward and calculate multiple points inside the cycle. Only pattern that I could think of was spiral, but I did’t know what kind of formula I need to have to calculate spirals. I googled it and it was a first time I came across Fibonacci and golden ratio (phi) 1,618… I have come up with different kind of ways to calculate the fluctuations and I have noticed that it works best in long time period forecasting and to Bitcoin. Probably for the reasons because it is not centralized and follows “more natural fluctuation”, even though it doesn’t always seem like it :D..but for now I have predicted the biggest changes with one dollar accuracy in away that I know the almost the exact time to buy and sell, so think it has worked pretty well. I see that the calculations have potential to calculate and predict many other natural growths for example in (society). I don’t know why exactly any of this works but at least it has increased my belief about the connection of math to surrounding universe and that there is patterns everywhere even in the things that doesn’t seem to act according to them. We just need to learn zoom in and out and focus to right information. Maybe the mutations in AI will some day become the key factor to help identify these patterns. ( But what if we identify these patterns and start acting against them, is it worthless then or do we just need to zoom again to identify new pattern?)
But I want to conclude that I am extremely fascinated by this and would like to find real explanations to all this, if someone has please share.
( Not native speaker or mathematician, maybe kitchen philosopher though)
Hi,
I am of the same opinion.
I’m very interested in your methodology, as I am searching for that golden ration to apply it to the world of Forex, or currency pairs.
Please make contact for a chat?
Best wishes,
Richard Fisher
Oh, I forgot to mention that I have the ability to create future mathematical arguments/predictions, based upon your work, so we could work together on this
Regards,
Richard
I live in the city of Bath, England.
I developed a new method of teaching and learning languages called iMagicEnglish.
I’m also a part time jazz singer
http://www.imagicsongs.com/richard
That is very interesting. If you would like to explore this further, let me know as I can point you in the right direction regarding resources written about this in the late 90s. Makes for interesting reading.
You can contact me on drmacca2@outlook.com
Drawing trend lines is one of the few easy techniques that really WORK. Prices respect a trend line, or break through it resulting in a massive move. Drawing good trend lines is the MOST REWARDING skill.
The problem is, as you may have already experienced, too many false breakouts. You see trend lines everywhere, however not all trend lines should be considered. You have to distinguish between STRONG and WEAK trend lines.
One good guideline is that a strong trend line should have AT LEAST THREE touching points. Trend lines with more than four touching points are MONSTER trend lines and you should be always prepared for the massive breakout!
This sophisticated software automatically draws only the strongest trend lines and recognizes the most reliable chart patterns formed by trend lines:
http://www.forextrendy.com
Chart patterns such as “Triangles, Flags and Wedges” are price formations that will provide you with consistent profits. Before the age of computing power, the professionals used to analyze every single chart to search for chart patterns. This kind of analysis was very time consuming, but it was worth it. Now it’s time to use powerful dedicated computers that will do the job for you.